> ## Documentation Index
> Fetch the complete documentation index at: https://ikun.mintlify.site/llms.txt
> Use this file to discover all available pages before exploring further.
# 指标
> 在 Agno 中了解代理运行和会话指标
## 概览
当您在 Agno 中运行代理时,您收到的响应(**RunResponse**)会包含有关该运行的详细指标。这些指标可帮助您了解资源使用情况(例如**令牌使用量**和**时间**)、性能以及模型和工具调用的其他方面。
指标可在多个层面获取:
* **每个消息**:每条消息(助手、工具等)都有自己的指标。
* **每次工具调用**:每次工具执行都有自己的指标。
* **聚合**:`RunResponse` 会聚合运行中所有消息的指标。
指标的位置
* `RunResponse.metrics`: 整个运行的聚合指标,以字典形式表示。
* `ToolExecution.metrics`: 每次工具调用的指标。
* `Message.metrics`: 每条消息的指标(助手、工具等)。
## 示例用法
假设您有一个执行某些任务的代理,并且想在运行后分析指标。以下是如何访问和打印指标的方法:
您运行以下代码来创建一个代理并使用以下配置运行它:
```python theme={null}
from typing import Iterator
from agno.agent import Agent, RunResponse
from agno.models.google import Gemini
from agno.tools.yfinance import YFinanceTools
from rich.pretty import pprint
agent = Agent(
model=Gemini(id="gemini-2.0-flash-001"),
tools=[YFinanceTools(stock_price=True)],
markdown=True,
show_tool_calls=True,
)
agent.print_response(
"What is the stock price of NVDA", stream=True
)
# 按消息打印指标
if agent.run_response.messages:
for message in agent.run_response.messages:
if message.role == "assistant":
if message.content:
print(f"Message: {message.content}")
elif message.tool_calls:
print(f"Tool calls: {message.tool_calls}")
print("---" * 5, "Metrics", "---" * 5)
pprint(message.metrics)
print("---" * 20)
# 打印整个运行的聚合指标
print("---" * 5, "Collected Metrics", "---" * 5)
pprint(agent.run_response.metrics)
# 打印整个会话的聚合指标
print("---" * 5, "Session Metrics", "---" * 5)
pprint(agent.session_metrics)
```
您将看到包含以下信息的输出:
### 工具执行指标
本节提供每次工具执行的指标。它包括有关各个工具调用资源使用情况和性能的详细信息。
 ### 消息指标
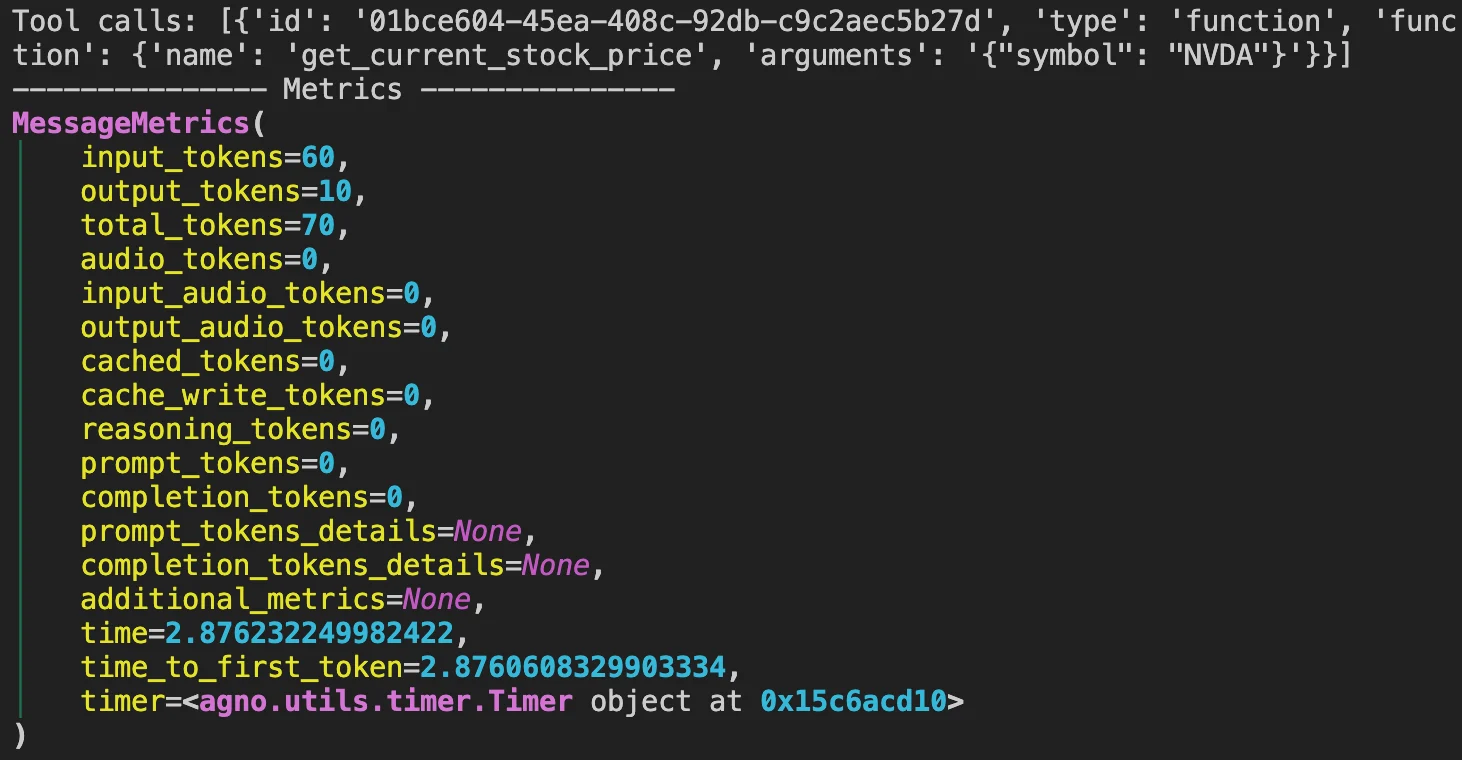
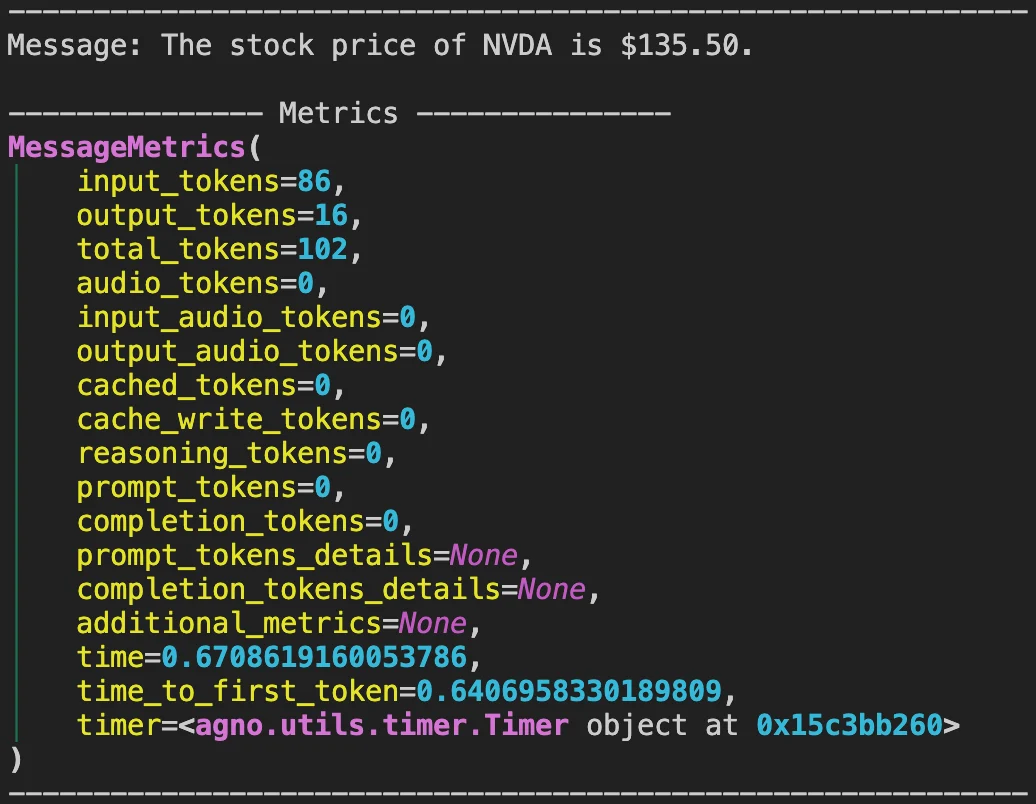
在这里,您可以查看代理每条消息响应的指标。所有“assistant”响应都将具有此类指标,帮助您了解消息级别的性能和资源使用情况。
### 消息指标
在这里,您可以查看代理每条消息响应的指标。所有“assistant”响应都将具有此类指标,帮助您了解消息级别的性能和资源使用情况。
 ### 聚合运行指标
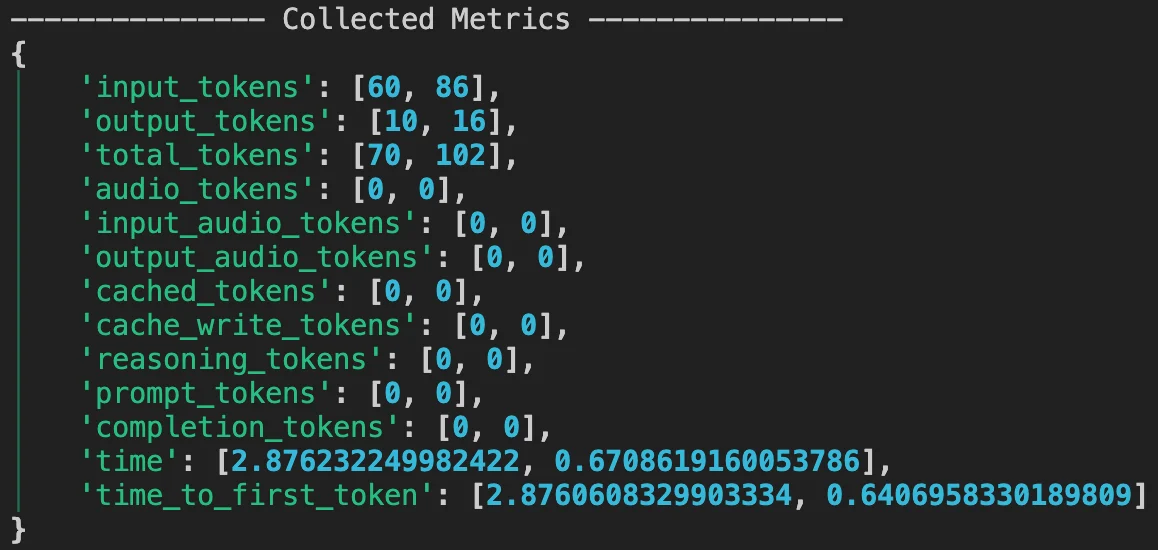
聚合指标提供了整个运行的全面视图。它包括所有消息和工具调用的摘要,让您对代理的整体性能和资源使用情况有一个总体了解。
### 聚合运行指标
聚合指标提供了整个运行的全面视图。它包括所有消息和工具调用的摘要,让您对代理的整体性能和资源使用情况有一个总体了解。
 同样对于会话指标,您可以查看会话中所有运行的聚合指标,从而深入了解代理在多次运行中的整体性能和资源使用情况。
## 指标如何聚合
* **每个消息**:每条消息(助手、工具等)都有自己的指标对象。
* **运行级别**:`RunResponse.metrics` 是一个字典,其中每个键(例如,`input_tokens`)映射到运行中所有助手消息的值列表。
* **会话级别**:`SessionMetrics`(请参阅 `agent.session_metrics`)跨会话中的所有运行聚合指标。
## `MessageMetrics` 参数
同样对于会话指标,您可以查看会话中所有运行的聚合指标,从而深入了解代理在多次运行中的整体性能和资源使用情况。
## 指标如何聚合
* **每个消息**:每条消息(助手、工具等)都有自己的指标对象。
* **运行级别**:`RunResponse.metrics` 是一个字典,其中每个键(例如,`input_tokens`)映射到运行中所有助手消息的值列表。
* **会话级别**:`SessionMetrics`(请参阅 `agent.session_metrics`)跨会话中的所有运行聚合指标。
## `MessageMetrics` 参数